Understanding Podcast Statistics
Every podcaster knows the feeling. You are eager to see how your show is performing, so you log into your hosting platform and pull up the latest numbers. But what do those figures actually mean, and how should they inform the decisions you make as a creator?
The answer is more complicated than it first appears. Podcast measurement has no single standard. Different platforms count the same actions in different ways, and the terminology itself can be deceptive. This briefing cuts through the confusion and explains what you are really looking at when you review your analytics.
The Vocabulary of Measurement
The industry uses these terms loosely, but they describe very different things.
- A download is a request for your audio file, whether or not it was ever heard.
- A play, listen, or view means someone pressed play. These describe actual consumption.
- Streaming is misleading in podcasting. Most shows are downloaded to a device for later playback, not streamed on demand.
- Total audience, or reach, cannot be calculated from downloads alone. No host has definitive data on your unique listeners.
The practical implication matters. If your show received 2,000 downloads last week, you cannot assume 2,000 people listened. Some downloads are never played. Some listeners use multiple devices. The number tells you about demand for your content, not about engagement with it.
Where Your Numbers Come From
Podcast data comes from three sources, each with its own strengths and blind spots.
Your Host
Platforms such as Buzzsprout, Podbean, and Captivate see every request for your files. The most complete download picture, though every host counts differently.
Third Parties
Services like Podtrac, Podscribe, and OP3 measure independently. Useful for comparing your performance against the wider field.
App Platforms
Apple, Spotify, and YouTube reveal how listeners engage inside their apps. Deep insight, but only within their own walls.
The Question of Standards
Two organizations have tried to standardize measurement: the Interactive Advertising Bureau (IAB) and the Alliance for Podcast Measurement (AMP).
The IAB has published guidelines on what counts as a download and how to size an audience. Some hosts describe themselves as "IAB Certified." It is worth remembering that the IAB measures devices, not people. Five plays from one listener can look like five listeners.
The AMP has published definitions for what a play is and how to count an audience, though these remain guidelines rather than technical standards. Spotify and YouTube may follow them more closely than Apple does.
Reading the Data Wisely
Hosted statistics show downloads. Apple shows plays. Spotify reports engagement over time. YouTube reveals retention minute by minute. Each tells a different part of the story, and no single figure is the whole truth.
- Trends beat totals. Downloads up 20% month over month is meaningful. Your raw number against another show's is often not.
- Know the methodology. Ask your host how they filter bots, handle duplicates, and which standard they follow.
- Combine your sources. Host data for your growth, third parties for comparison, app analytics for behavior.
- Reach and craft are not the same. A show heard by millions is remarkable. So is a show of exceptional quality with a devoted audience. They are different achievements.
That last point sits at the heart of how the Guild recognizes work. Reach is honored on its own terms, and craft is judged on its own terms, and neither is asked to stand in for the other.
A Real Dashboard, Read Line by Line
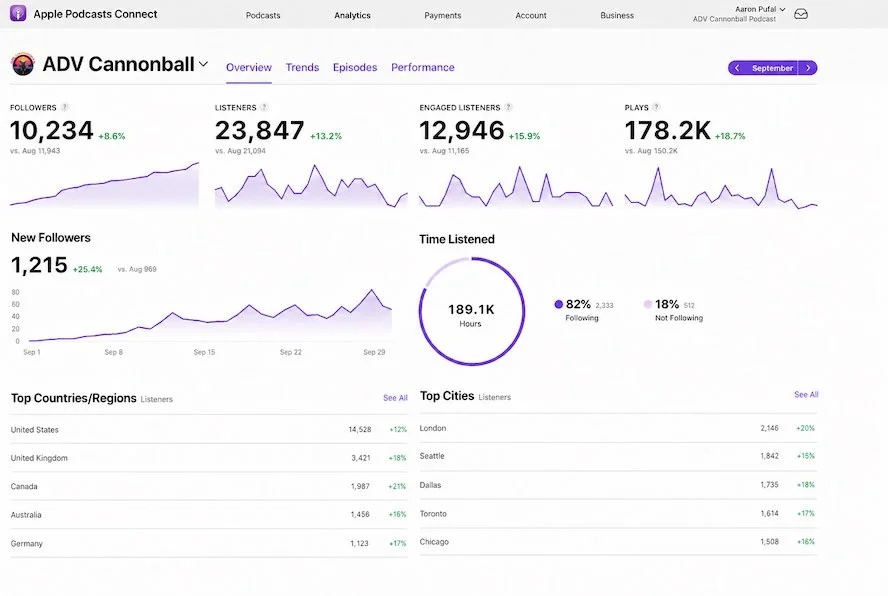
Definitions are easier to trust when you can see them at work. Below is a single month from Apple Podcasts Connect for ADV Cannonball, an adventure motorcycling show. It is a useful teaching case because Apple reports plays rather than downloads, and it separates the audience into distinct measures that are easy to confuse.
Apple Podcasts Connect / ADV Cannonball / September
Four headline numbers sit across the top. Read together, they tell a fuller story than any one of them could alone.
Followers are the people who subscribed to the show inside Apple Podcasts. Listeners is the larger figure, because it counts everyone who pressed play, whether they follow the show or not. Engaged listeners is the number who stayed with an episode past Apple's engagement threshold, and it is arguably the most honest measure of the four: it counts attention, not merely arrival. Plays is the largest number of all, because a single listener can generate many plays across many episodes.
Notice the shape of it. Nearly 24,000 people listened, but under 13,000 stayed engaged, and just over 10,000 cared enough to follow. Each step down that funnel is a more demanding test of the work. A show that narrows the gap between plays and engaged listeners is doing something on the craft side that a raw download count would never reveal.
Apple also reports time listened, here 189.1K hours for the month, split 82 percent from followers and 18 percent from listeners who have not yet followed. That split is a quiet health check. A show carried almost entirely by existing followers has a loyal base but a discovery problem, while a steady stream of non follower hours means new people are still finding the work.
The geography tells the rest. Reach is rarely a single market, and the healthiest shows travel.
Top Countries
Top Cities
One country supplies the base, but four others carry real weight, and the top cities are spread across three continents. This is what a maturing audience looks like on a dashboard. No single figure on this screen is the whole truth, yet read in sequence, followers to listeners to engaged to plays, then hours and geography, they describe a show with genuine reach and genuine hold. That is precisely the kind of work the Guild exists to recognize.
What Good Actually Looks Like
New podcasters often measure themselves against the wrong yardstick, holding a first season audio show up against a celebrity video series with a marketing department behind it. The honest comparison is the median, the midpoint where half of all shows do better and half do worse. Buzzsprout, one of the largest hosting companies, publishes exactly that. Here is where a single episode lands by its download count in the first seven days.
Source: Buzzsprout platform benchmarks, 2026. Downloads within seven days of release.
Read the top line again, because it surprises almost everyone. An episode that reaches 28 downloads in its first week is already in the upper half of all podcasts. Cross 428 and you stand in the top ten percent. The figures that look small on a screen are, in context, numbers most shows never reach. Judge yourself against the middle of the field, not against its outliers.
The Numbers An Editor Can Move
Most podcast statistics describe what already happened. A few can be improved by the work itself, and those are the ones an editor should watch. The most important is consumption, the measure of how far into an episode people listen before they stop.
Apple counts an engaged listener as someone who stays for roughly 40 percent of an episode, or about twenty minutes, whichever comes first. That is a craft number. It moves when the edit is tighter, when the hook arrives sooner, when the pacing holds. Plays measure your title and your artwork. Engaged listeners measure your editing.
The consumption curve tells you where to cut. A sharp drop in the first minute usually means the introduction runs too long, or the hook is buried behind housekeeping. A slow bleed through the middle usually points to pacing: a segment that overstays, a tangent that should have been trimmed. Read the curve like notes from your audience, because that is exactly what it is.
One number matters more than any single download figure: whether the next episode exists at all. Of the roughly five million podcast titles ever created, only about 180,000 are still active. Most shows simply stop. Publishing consistently, on a schedule your audience can rely on, is the single largest advantage available to a new podcaster, and it costs nothing but persistence.
Annual Podcast Awards
Judged by a panel of industry professionals against published criteria. Craft over charts. Download figures are not a category.
Enter the awards →Download Achievement Awards
Honoring shows that reach significant listenership milestones. Audience building, earned episode by episode.
See the milestones →Judge The Work,
Not The Numbers.
If you can tell craft from a download count, the Guild wants you on the panel. Membership is a working role for the people who make podcasting, not a subscription and not a product. There are no costs and no dues. It asks for your judgment, nothing more.
Apply to Join the Guild